Today am working on a project offered by theforage.com in colaboration with J.P Morgan Chase & Co. First is to download the tasks instructions and I start by installing python. I launch my CMD console in windows and typed python, hit enter in the microsoft store opened up with the latets version of python, click download and install. After installation completed I click launch and the pytho console opened up. Next is to create an enviroment isolation using anaconda.
Go to the official anaconda.com website and click download, enter an email address and you will get the download link there. Go to it and click download again, download and click install, follow the prompts as recommended and go thru the installation wizard.
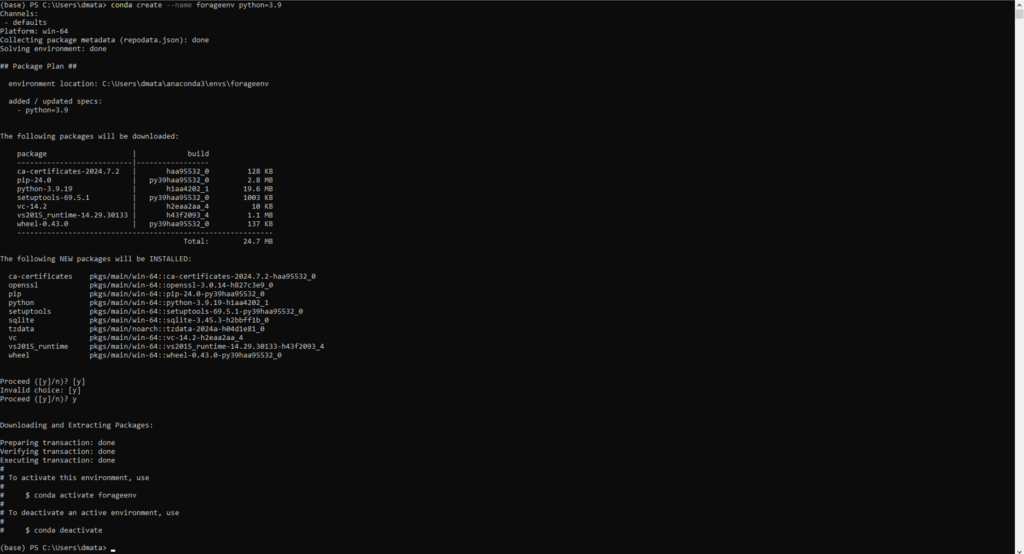
Back to CLI and type conda create –name forageenv python=3.9
If that doesn’t work like in my case type anaconda in the search bar and click the powershell open anaconda, then type the line stated above and it should work. It did for me.

- Type conda activate forageenv and hit enter
- Ran into the following error : ERROR: Could not open requirements file: [Errno 2] No such file or directory: ‘requirements.txt’
- Type dir to show current directories and search thru them.
- Never found the file so I installed each package individually. Prompts are :
- pip3 install numpy
- pip3 install pandas
- pip3 install jupyter
- Next check each package is good by running import numpy, import pandas, import jupyter
- No errors were listed so enter exit() to exit the python commands line and then type jupyter notebook and press enter. Select desired web browser.
- Now let’s get to programming, here you can see the entire code as well as the results from it. Please note I relied on Chat GPT4 to complete the programming tasks past the functions definition since am not a programmer but still loved it.
import pandas as pd
def exercise_0(file):
    df = pd.read_csv(file)
    return df

def exercise_1(df):
    return df.columns.tolist()

def exercise_2(df, k):
    return df.head(k)

def exercise_3(df, k):
    return df.sample(n=k)

def exercise_4(df):
    return df['type'].unique().tolist()

def exercise_5(df):
    return df['nameDest'].value_counts().head(10)

def exercise_6(df):
    return df[df['isFraud'] == 1]

def exercise_7(df):
    return df.groupby('nameOrig')['nameDest'].nunique().sort_values(ascending=False).reset_index(name='unique_destinations')


import matplotlib.pyplot as plt


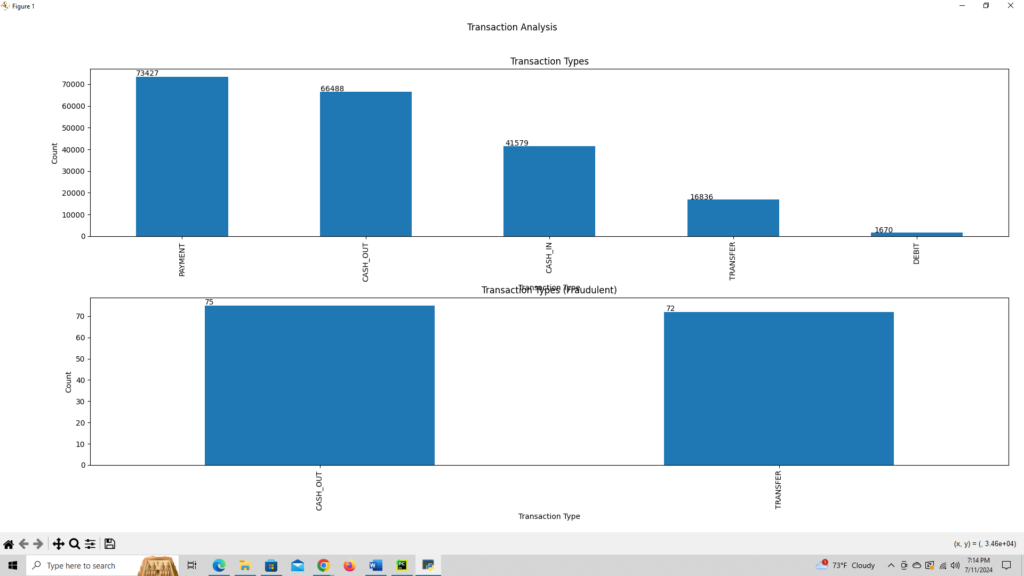
def visual_1(df):
    def transaction_counts(df):
        return df['type'].value_counts()

    def transaction_counts_split_by_fraud(df):
        return df[df['isFraud'] == 1]['type'].value_counts()

    fig, axs = plt.subplots(2, figsize=(10, 12))

    transaction_counts(df).plot(ax=axs[0], kind='bar')
    axs[0].set_title('Transaction Types')
    axs[0].set_xlabel('Transaction Type')
    axs[0].set_ylabel('Count')

    transaction_counts_split_by_fraud(df).plot(ax=axs[1], kind='bar')
    axs[1].set_title('Transaction Types (Fraudulent)')
    axs[1].set_xlabel('Transaction Type')
    axs[1].set_ylabel('Count')

    fig.suptitle('Transaction Analysis')
    fig.tight_layout(rect=[0, 0.03, 1, 0.95])

    for ax in axs:
        for p in ax.patches:
            ax.annotate(str(p.get_height()), (p.get_x() * 1.005, p.get_height() * 1.005))

    plt.show()
    return 'Transaction types bar chart and split by fraud'


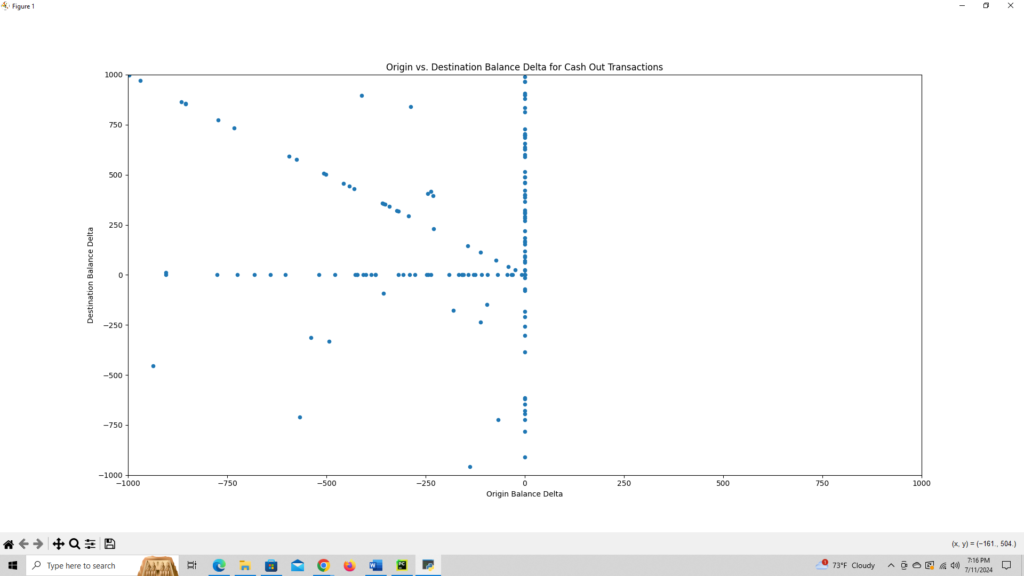
def visual_2(df):
    def query(df):
        return df[df['type'] == 'CASH_OUT'][['oldbalanceOrg', 'newbalanceOrig', 'oldbalanceDest', 'newbalanceDest']]

    plot_data = query(df)
    plot_data['balance_delta_orig'] = plot_data['newbalanceOrig'] - plot_data['oldbalanceOrg']
    plot_data['balance_delta_dest'] = plot_data['newbalanceDest'] - plot_data['oldbalanceDest']

    plot = plot_data.plot.scatter(x='balance_delta_orig', y='balance_delta_dest')
    plot.set_title('Origin vs. Destination Balance Delta for Cash Out Transactions')
    plot.set_xlabel('Origin Balance Delta')
    plot.set_ylabel('Destination Balance Delta')

    plt.xlim(left=-1e3, right=1e3)
    plt.ylim(bottom=-1e3, top=1e3)

    plt.show()
    return 'Scatter plot of Origin vs. Destination Balance Delta for Cash Out transactions'

def exercise_custom(df):
    # Example: Return transactions where the amount is greater than a threshold
    threshold = 100000
    return df[df['amount'] > threshold]

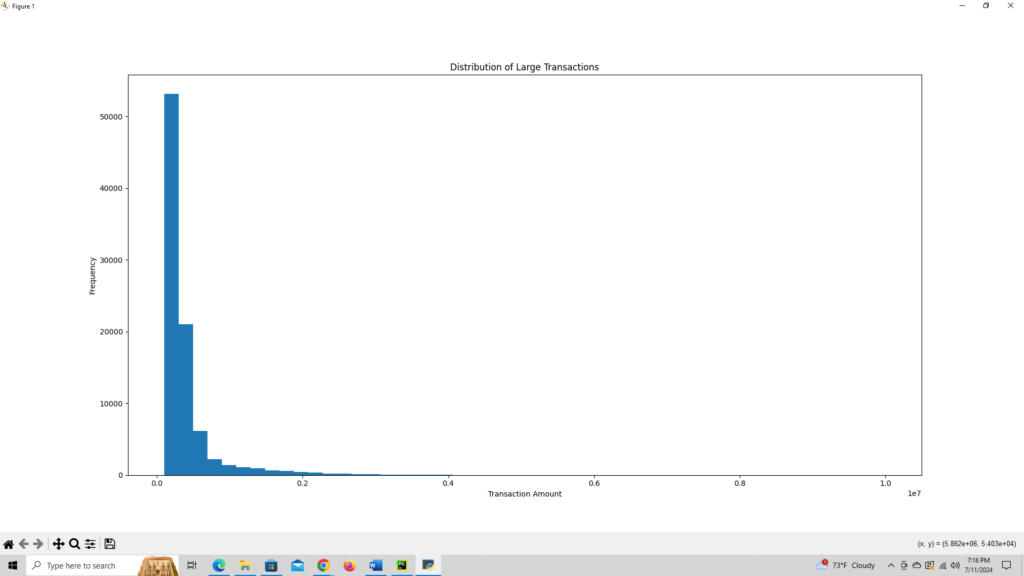
def visual_custom(df):
    df_custom = exercise_custom(df)
    plt.figure(figsize=(10, 6))
    plt.hist(df_custom['amount'], bins=50)
    plt.title('Distribution of Large Transactions')
    plt.xlabel('Transaction Amount')
    plt.ylabel('Frequency')
    plt.show()
    return 'Histogram of transactions with amount greater than 100,000'

# Load dataset
df = exercise_0('transactions.csv')

# Test exercises
print(exercise_1(df))
print(exercise_2(df, 5))
print(exercise_3(df, 5))
print(exercise_4(df))
print(exercise_5(df))
print(exercise_6(df))
print(exercise_7(df))

# Create visualizations
print(visual_1(df))
print(visual_2(df))
print(visual_custom(df))


